by Domenicantonio De Giorgio
In my two posts on X earlier today I made the point bluntly: the European Union's energy architecture is rotten from within and the market itself is not the problem.
Five years into this EU home-made energy chaos what is appalling is how little is understood about how the new global LNG market actually allocates scarce molecules. The latest leg-up in the price of the European Natural Gas benchmark - the TTF - is, if anything, the clearest evidence that the market is working exactly as it should: European operators are simply doing everything they can to outbid the competition for those scarce cargoes. But the root cause of this year's misery isn't today's price action — it's the storage shortfall I flagged back in October 2025.
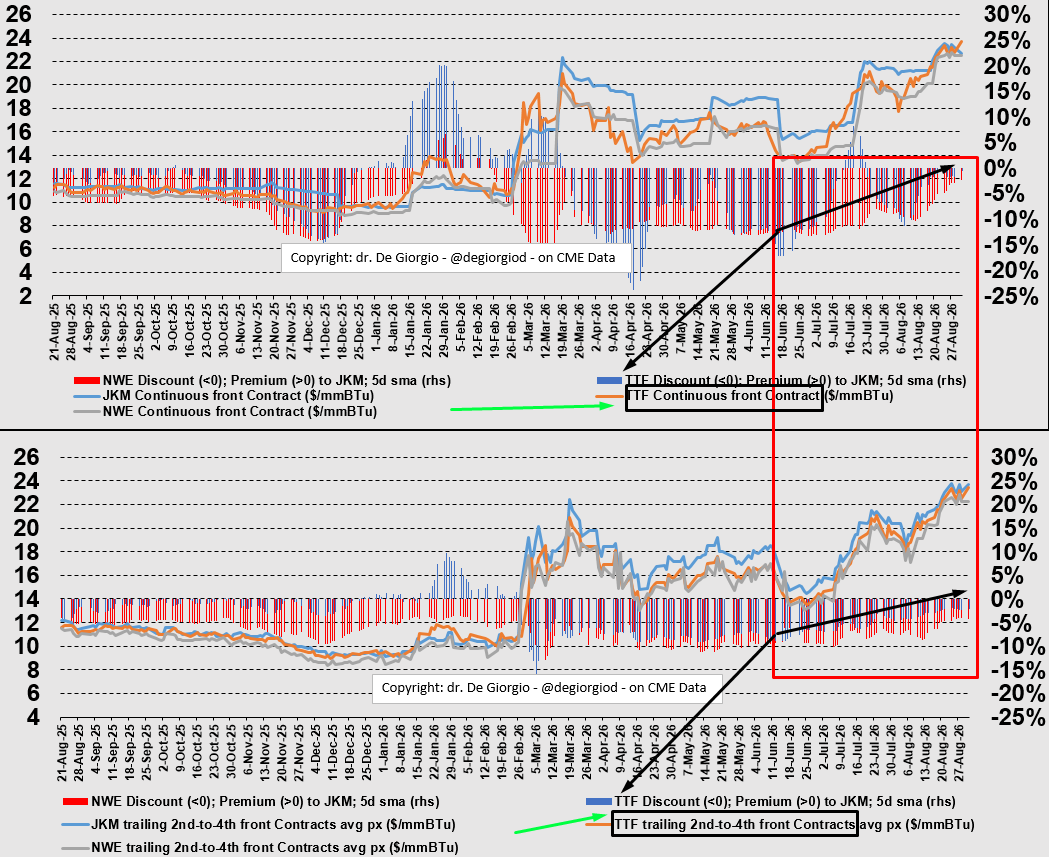
The dual-panel chart I published today makes that mechanism visible. Both panels track the absolute JKM, NWE and TTF prices alongside the five-day smoothed TTF (and NWE) discount or premium to the Asian benchmark. The red box isolates the critical window from mid-June to late August. Two of the four black arrows point to where that series has actually gone: a decisive climb out of deep discount, or neutrality, through zero and beyond. European buyers are heating up the competition to keep refilling the otherwise very depressed levels of Natural Gas physical storage. As the summer draws to an end they are now paying an increasingly smaller discount/larger premium than their Asian counterparts for the privilege. That relative shift, mirrored by the rising absolute TTF front contract, is price rationing in plain sight.
None of this should come as a surprise: it was already foreshadowed in the analysis I posted on 15 August, where I showed how European-Asian price competition had reheated after the early-spring lull.
The price competition between European and Asian buyers did heat up from the early spring 2026 doldrums. The evidence of this is shown in the complex chart below, and its outcome is proven in the reposted post. The fatal mistake was 1/ https://t.co/LH6v9wVzu4 pic.twitter.com/Buj6WEDhjO
— Domenico De Giorgio, EU. Capre Diem (not a typo). (@degiorgiod) August 15, 2026
The winter-to-summer calendar-strip charts captured that shift in relative premiums. The fatal mistake, as I underlined at the time, was starting the 2026 refill season from stupidly low inventory levels.
And those April 2026 low starting levels trace directly back to the data I published on 21 October 2025. EU-wide storage injections peaked on 13 October at just 83.15% (948.86 TWh), fifteen days earlier, and roughly 9% lower, than the same point the previous year, and 14% below the five-year average.
>>>EU Act of Faith on LNG and Renewables<<<
— Domenico De Giorgio, EU. Capre Diem (not a typo). (@degiorgiod) October 21, 2025
Injections into EU-wide storage systems peaked on October 13th at 83.15% full ($948.86 TWh), 15 days earlier than last year (when $1,093.9TWh was hit on October 28th, 2024), and 23 days earlier than 2023's peak ($1,135.6TWh hit 1/ https://t.co/CEzXN3KiAf pic.twitter.com/ZIesZBVjAe
The shortfall was especially severe in Germany and the Netherlands - precisely the regions carrying the highest share of intermittent renewables - and other several landlocked states. I called it an act of faith at the time: the simultaneous bet that LNG would stay both plentiful and cheap, and that renewables wouldn't disappoint again. That faith left Europe structurally exposed.
Put the three pieces together and it's one continuous story: the October 2025 storage shortfall created the vulnerability; the subsequent intensification of European-Asian bidding converted it into higher TTF prices; and today's chart, with its four black arrows, simply records the market's transparent response. At this point, only an unusually mild winter could still soften the blow.
The architecture remains the problem. The market is doing exactly what it's supposed to do.
Listen to my Podcast "Dalla Realtà al Mercato, dal Mercato alla Realtà"